Conagra Brands owns many iconic brands in the food business (Exhibit 1). The company is categorized as a consumer staple.
Exhibit 1:
Here's the histogram of monthly returns of Conagra Brands between June 2019 and November 2022 (Exhibit 2). Please click on the image to see an enlarged version.
Exhibit 2:
 |
Conagra Brands Histogram of Monthly Returns (Source: Data Provided by IEX Cloud, Author Calculations using Excel)
The average monthly returns of Conagra Brands (Exhibit 3) are very similar to that of the Vanguard S&P 500 Index ETF (Exhibit 4).
Exhibit 3:
(Source: Data Provided by IEX Cloud, Data Calculations Using Excel)
Exhibit 4:
(Source: Data Provided by IEX Cloud, Data Calculations Using Excel)
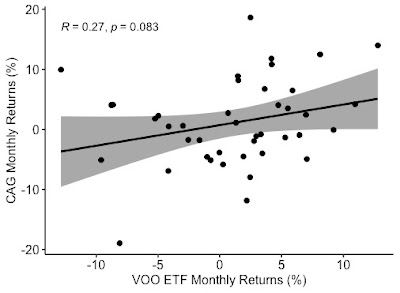
The monthly returns of Conagra Brands and the Vanguard S&P 500 Index ETF have a mild positive correlation of 0.27 (Exhibit 5).
Exhibit 5:
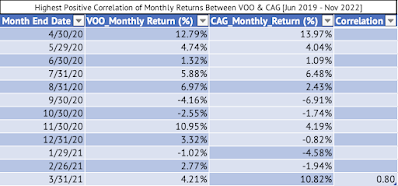
A 12-month rolling correlation of the monthly returns yielded a very high positive correlation of 0.8 between April 2020 and March 2021 (Exhibit 6).
Exhibit 6:
(Source: Data Provided by IEX Cloud, Correlation Calculations Using RStudio)
A 12-month rolling correlation of the monthly returns yielded the highest negative correlation of 0.37 between July 2021 and June 2022 (Exhibit 7).
Exhibit 7:
(Source: Data Provided by IEX Cloud, Correlation Calculations Using RStudio)
A linear regression model estimates Conagra's Beta at 0.34, which is not statistically significant at the 95% confidence interval. The p-value is 0.083, suggesting that the correlation is not statistically significant.
Here's the output of the linear model:
Call: lm(formula = CAG_Monthly_Return ~ VOO_Monthly_Return, data = VOOandCAG)
Residuals: Min 1Q Median 3Q Max -0.168638 -0.044057 -0.004737 0.045175 0.170379
Coefficients: Estimate Std. Error t value Pr(>|t|) (Intercept) 0.007141 0.011079 0.645 0.5229 VOO_Monthly_Return 0.342593 0.192981 1.775 0.0835 . --- Signif. codes: 0 ‘***’ 0.001 ‘**’ 0.01 ‘*’ 0.05 ‘.’ 0.1 ‘ ’ 1
Residual standard error: 0.07047 on 40 degrees of freedom Multiple R-squared: 0.07303, Adjusted R-squared: 0.04986 F-statistic: 3.152 on 1 and 40 DF, p-value: 0.08346
The adjusted R-squared is 0.049, meaning that just 4.9% of Conagra's monthly returns can be explained by the monthly returns of the Vanguard S&P 500 Index ETF.
|


No comments:
Post a Comment