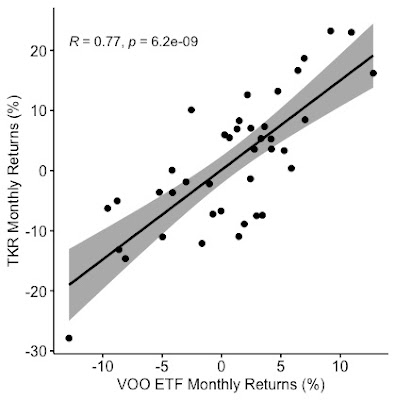
Here is the graph of monthly returns between June 2019 and September 2022 of Timken (TKR) plotted against Vanguard S&P 500 Index ETF (VOO):
Exhibit: Monthly Returns of VOO and TKR between June 2019 and September 2022
The monthly returns of Timken have a very strong positive correlation of 0.77 with the S&P 500 Index. The very low p-value (p = 6.2e-09) indicates that the monthly returns of the S&P 500 Index have an effect on Timken's monthly returns.The Beta value indicates the monthly return volatility of Timken compared to the S&P 500 Index. Yahoo Finance provides a Beta value of 1.59 based on monthly returns over the past five years. A linear regression of the monthly returns between June 2019 and September 2022 yields a Beta of 1.48. The coefficient of Vanguard's monthly return is the volatility of Timken. The coefficient is the linear regression line's slope and Timken's Beta value. In other words, as the monthly return of the Vanguard S&P 500 Index ETF changes by 1%, Timken's monthly return can change by an average of 1.48%.
Timken's Beta value is one of the highest I have seen. Here are the Beta values of some of the stocks in another post on this blog.
Here's the output of the linear regression between the monthly returns of Vanguard S&P 500 Index ETF and Timken:
Call:
lm(formula = TKR_Monthly_Return ~ VOO_Monthly_Return, data = VOOandTKR)
Residuals:
Min 1Q Median 3Q Max
-0.132602 -0.047815 -0.000585 0.059694 0.137770
Coefficients:
Estimate Std. Error t value Pr(>|t|)
(Intercept) 0.001198 0.011348 0.106 0.916
VOO_Monthly_Return 1.489061 0.199966 7.447 6.17e-09 ***
---
Signif. codes: 0 ‘***’ 0.001 ‘**’ 0.01 ‘*’ 0.05 ‘.’ 0.1 ‘ ’ 1
Residual standard error: 0.07103 on 38 degrees of freedom
Multiple R-squared: 0.5934, Adjusted R-squared: 0.5827
F-statistic: 55.45 on 1 and 38 DF, p-value: 6.168e-09


