Showing posts with label Growth. Show all posts

Tuesday, October 10, 2023

Paccar: Peak Demand For Trucks

 Paccar (PCAR) produced 185,900 trucks in 2022 and is on track for another record year in 2023. The company has experienced good revenue growth in 2021 and 2022. The company has experienced stellar gross and operating margins over the past few years. The company registered a 16% gross and 13% operating margin in 2022. The current fiscal year, 2023, may bring even more good news on the margin front. The company registered a 20% gross and 17% operating margin in its March 2023 quarter and maintained its 17% operating margin in June 2023. 

Unfortunately, the demand for trucks may have peaked, given high-interest rates, high inflation, and waning consumer demand. Some of the strength in the truck market was due to the stimulus and subsidies provided by the U.S. Federal Government that bolstered infrastructure spending and brought about a manufacturing renaissance in this country. Although the bills passed by Congress in 2022 have more spending left for a few more years, the weakening consumer and lack of demand in the real estate sector may counteract the spending by the Federal Government. Fiscal year 2023 may be as good as it gets for Paccar. The stock has performed well over the past year, and its dividend yield has fallen. Dividend income seekers may have to wait for a much higher dividend before buying the stock. Treasury rates have increased enough that bonds offer an attractive alternative for investors waiting for a higher yield. Due to these reasons, I rate it a hold.

Exceptional performance of Paccar.

Paccar has performed exceptionally well over the past year, gaining 50% (Exhibit 1). The stock has handily outperformed the S&P 500, which has returned 15% over the past year. Cummins (CMI) gained just 3% over the past year. Year-to-date, the stock has gained 33% compared to the 12% return of the S&P 500 Index (SP500). The Vanguard Industrials Index Fund ETF (VIS) has had a great year, with a return of 16% over the past year. The industrial sector has benefitted from the stimulus and subsidy spending by the U.S. Federal Government. Although more subsidy spending is left in the coming years under the bill authorized by Congress in 2022, a combination of high interest rates and a slowing global economy may cap any upside in this stock.

Exhibit 1: 
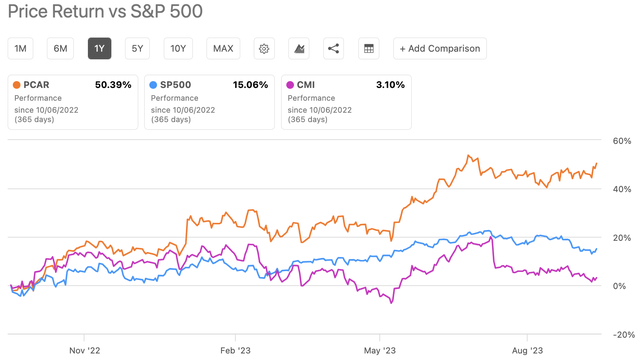
Performance of Paccar, S&P 500, and Cummins

Performance of Paccar, S&P 500, and Cummins (Seeking Alpha)

Fully valued

Although the stock, trading at a forward GAAP PE of 11.4x, looks undervalued compared to its five-year average of 14.4x, given the economic environment and the rate increase, this lower valuation may be deserved. The Vanguard Industrial Index ETF (VIS) may be overvalued, trading at a weighted average PE of 20x and a price/book ratio of 4x. The EV/EBITDA multiple may better assess the company’s valuation. The stock trades at a 10.2x forward EV/EBITDA multiple compared to the sector median of 10.7x. This indicates the stock may be fully valued. Cummins (CMI), a Paccar peer, looks undervalued, trading at a 7.8x forward EV/EBITDA multiple.

Dividends, buybacks, and debt.

Given the stock's performance over the past year, the yield has dropped to 1.2%. The Vanguard Industrials ETF offers a yield of 1.4%, and the Vanguard S&P 500 Index ETF yields 1.58%. The payout ratio is 12%, a rather conservative number. But, given the cyclical nature of the truck business, Paccar may be suitable to be cautious with its payout. A low payout may also free up cash for stock repurchases. The company paid $483 million in total dividend payments over the trailing twelve months. The company has grown its dividend annually at the pace of 7.5%, compared to 6.8% for the sector, over the past five years.

Paccar has spent $828 million in share buybacks over the past decade. But, the company has issued over $300 million in stock over the past decade, blunting the share buybacks' effects. The diluted share count is reduced from 532.8 million in 2013 to 524.1 million over the trailing twelve months, just 8.7 million. Using this share count reduction, the average price paid for the buybacks is $95 compared to its current price of $86.

The company generated $5.4 billion in EBITDA during the trailing twelve months. Paccar generated $3.5 billion in operating cash and $2.37 billion in free cash flow. This free cash flow number is derived by deducting the company’s capital expenditures from its operating cash. These numbers are good, but investors should remember that 2022 was one of the strongest years for truck demand globally, and 2023 is shaping to be another good year. I am concerned these good times, and any demand reduction could dent its cash flows. Also, the company generates a lot of revenue from its financing division. If the economy slows further and demand wanes, it could increase bad loans and decrease the demand for new loans, as the U.S. Treasury rates have increased to their highest levels in over a decade.

Paccar has performed exceptionally well over the past decade, returning 237% on a total return basis compared to the 210% return of the S&P 500 Index. But, weakening consumers coupled with high rates may put a substantial dent in demand across the various sectors of the economy. The stock’s performance has been impressive, and the industrial sector has been strong over the past year. Most of this strength may be attributed to the various bills passed by the U.S. Congress that have billions of dollars in outlays for renewable energy, electric vehicles, infrastructure modernization, and efforts to re-shore manufacturing and build semiconductor plants. Investors should be concerned that most of the demand across the industrial sector and Paccar is driven not by consumer organic demand but by the government's industrial policy. Paccar’s strength may not last, and it may be best for investors to wait for a much lower entry point.

Tuesday, January 31, 2023

Why is the stock of Goodyear Tire & Rubber Co. So Volatile?

Goodyear (GT) is a very volatile stock with a beta of 1.86, measured using a linear regression model. This linear regression model used monthly returns for Goodyear and the Vanguard S&P 500 Index ETF (VOO) from June 2019 to January 2023. This beta is one of the highest I have encountered among the stocks I cover (Exhibit 1).

Image: 90% Sustainable Material Demonstration Tire

Source: Goodyear Tire & Rubber Co.


The stock is heavily dependent on the discretionary spending of the consumer. In a downturn, car sales drop, thus affecting Goodyear's sales. The replacement tire sales also drop in an economic slowdown, affecting the company. These might be the reasons behind the high volatility.   

Note: Please click on the image to see an enlarged version.

Exhibit 1: Beta of Stocks in Industrial, Consumer Staples, Technology, and Consumer Discretionary Sectors  

Source: Data Provided by IEX Cloud, Author Calculations using Microsoft Excel & RStudio


Here's the output from the linear regression model:

Call:
lm(formula = GT_Monthly_Return ~ VOO_Monthly_Return, data = VOOandGT)

Residuals:
     Min       1Q   Median       3Q      Max 
-0.21099 -0.10456 -0.01782  0.07052  0.55012 

Coefficients:
                    Estimate Std. Error t value Pr(>|t|)    
(Intercept)        -0.008481   0.021853  -0.388      0.7    
VOO_Monthly_Return  1.869864   0.379106   4.932 1.33e-05 ***
---
Signif. codes:  0 ‘***’ 0.001 ‘**’ 0.01 ‘*’ 0.05 ‘.’ 0.1 ‘ ’ 1

Residual standard error: 0.1425 on 42 degrees of freedom
Multiple R-squared:  0.3668, Adjusted R-squared:  0.3517 
F-statistic: 24.33 on 1 and 42 DF,  p-value: 1.326e-05

The coefficient for "VOO_Monthly_Return" is the beta for the stock.  This coefficient is also the slope of the line.  The monthly returns of Goodyear have been plotted against the returns of the Vanguard S&P 500 Index ETF (Exhibit 2). Exhibit 3 shows the residuals from the linear regression mode. There is a solid positive monthly return correlation of 0.61 between the Vanguard ETF and Goodyear. There is also a significant relationship between the monthly returns of the Vanguard ETF and Goodyear, with a p-value of 1.3e-05.     

Exhibit 2: Monthly Returns Plot of the Vanguard S&P 500 Index ETF and Goodyear Tires

Source: Data Provided by IEX Cloud, Author Calculations Using Microsoft Excel, and Graph Plotted Using RStudio


Exhibit 3: Residuals from the Linear Regression of the Vanguard S&P 500 Index ETF and Goodyear Tires Monthly Returns
Source: Data Provided by IEX Cloud, Author Calculations Using Microsoft Excel, and Graph Plotted Using RStudio


Monday, January 31, 2022

Copper Prices at 5-Week Lows. Is this a Bad Sign for the Global Economy?

Aluminum and copper prices are a study in contrast. Aluminum is trading near all-time highs (See Exhibit 1: Aluminum Trading Near All-time High Price) while copper's rally is beginning to fade. Copper is trading at 5-week lows.  

Exhibit 1: Aluminum Trading Near All-time High Price

According to Trading Economics, low inventory levels, the power crisis in Europe, and Ukraine-Russia tensions are all to blame for this incredible rally in aluminum.

Meanwhile, copper prices are at five-week lows due to the strong dollar and increased production. Trading Economics reports that Chilean authorities are projecting that copper production will increase by 4.1% during 2022, returning to pre-pandemic levels. Even at its current price of $4.32/lb, copper is trading at all-time highs (See Exhibit 2: Copper Prices at 5-Week Lows). I am watching copper see if it falls below $4/lb. Falling below that price level may be a bearing sign not only for copper but for the world economy.

Exhibit 2: Copper Prices are at 5-Week Lows


If copper continues to fall, the stock prices for miners, such as Rio Tinto (RIO), might fall with it. The share price of Rio Tinto has tumbled about 9% from its peak of approximately $78.48 achieved in mid-January (See Exhibit 3: Rio Tinto's Share Price Takes a Hit in January).

Exhibit 3: Rio Tinto's Share Price Takes a Hit in January

(Source: Seeking Alpha)


Sunday, December 12, 2021

Oracle: Excelling in Financial Engineering.

Oracle (ORCL) faced its first real challenge to its business model from Amazon AWS (AMZN). For a long time, Oracle's relational database has been the standard for many companies in the Global 2000. Oracle's database is still so entrenched in many corporations across the globe that they pay millions of dollars in Oracle license and support fees each year to keep the right to use their software. But, companies formed in the last 10-15 years have shunned the Oracle database. Instead, they have relied on myriad open-source database options and cheaper databases from other companies. The advent of AWS made it easy for any company to manage databases in the cloud. 


Oracle has lagged behind the prominent three cloud vendors in offering infrastructure-as-a-service (IaaS). The company has a reasonably significant market share position in SaaS software, where it competes against the likes of Salesforce (CRM), Workday (WDAY), and SAP (SAP). But, Oracle is still heavily dependent on revenue from its database software. Since Oracle cannot attract new customers to its database, it has resorted to using its existing database install base as an annuity business. In essence, the Oracle database software generates much rental income from its remaining customers.  


In the face of Oracle management's inability to innovate and compete, they have resorted to financial engineering to prop up their share price. A company innovating and competing well in the marketplace is most likely growing revenues. At the very least, revenue growth needs to keep up with GDP growth. Unfortunately, there is no revenue growth at Oracle. In the fiscal year ending May 31, 2011, Oracle had total sales of $35.622 billion. In the fiscal year ending May 31, 2021, Oracle had total sales of $40.479 billion. That equates to a 13.6% growth in revenue over 11 years. The 13.6% rate amounts to a compound annual growth rate (CAGR) of 1.16%

Exhibit: Oracle Annual Sales Revenue from Fiscal Year Ending on May 31, 2011

(Source: SEC.GOV)

How does a company show earnings per share (EPS) growth when revenue growth is nonexistent? Investors react positively to a growing EPS number. One way to show an ever-increasing EPS number is to repurchase the company shares and retire them. The repurchase transaction reduces the outstanding shares, and thus when stagnant net income is divided by outstanding shares, the resulting EPS number looks as if it is growing. 

The company has spent billions of dollars each year repurchasing its stock. The company has spent $137.65 billion in repurchasing its shares in 11 years. Initially, the share repurchases did not do much to the stock price. So, in recent years, the company has gotten even more brazen in buying back its stocks (See Exhibit: Annual Amount in Billions Spent by Oracle on Share Repurchase).  

Exhibit: Annual Amount in Billions Spent by Oracle on Share Repurchase 

(Source: SEC.GOV)
One way to analyze how much the company has spent on its repurchase is to compare its operating cash flow to the repurchase amount. The company had $155.212 billion in operating cash flow in 11 years and it spend 88.6% of that in buying back its own shares.
 
Exhibit: Oracle's Annual Operating Cash Flow

(Source: SEC.GOV)
In the end, Oracle's management led by Safra and the company's largest shareholder - Larry Ellison - benefit the most from these buybacks. Larry is now on the list of the top-10 wealthiest people in the world solely due to these buybacks. Due to these buybacks, the stock has risen a lot, and ordinary investors should prudently book profits. You do not want to be in this stock when the music stops.  


Analyze Earnings Press Releases Using Snowflake Cortex LLM SQL Functions

Snowflake Cortex AI Product Stack (Source: Snowflake)   📊 Are you an asset manager, investment professional, or anyone dealing with large ...